InvestEd
InvestEd is an interactive financial literacy web application designed to educate beginners about investment. By providing real-time simulations and jargon-free education, the platform helps users visualize the long-term impact of compound interest and different asset classes. This project serves as a bridge between complex financial data and accessible, user-centric design.
The Brief
Target Audience
-
Young Adults & Students: Beginners looking for a starting point in wealth management without the intimidation of complex jargon.
-
Career Starters: Individuals planning their long-term financial goals and retirement targets.
-
Non-Finance Professionals: People seeking a visual way to compare banking products versus market-based investments.
My Role
-
Full-Stack Architecture: Designed and implemented the backend using Flask and built a highly responsive frontend integrated with Chart.js for real-time data reactivity.
-
Algorithm Engineering: Programmed the core calculation engine to handle complex financial formulas, including the future value of annuities and the "Rule of 72."
-
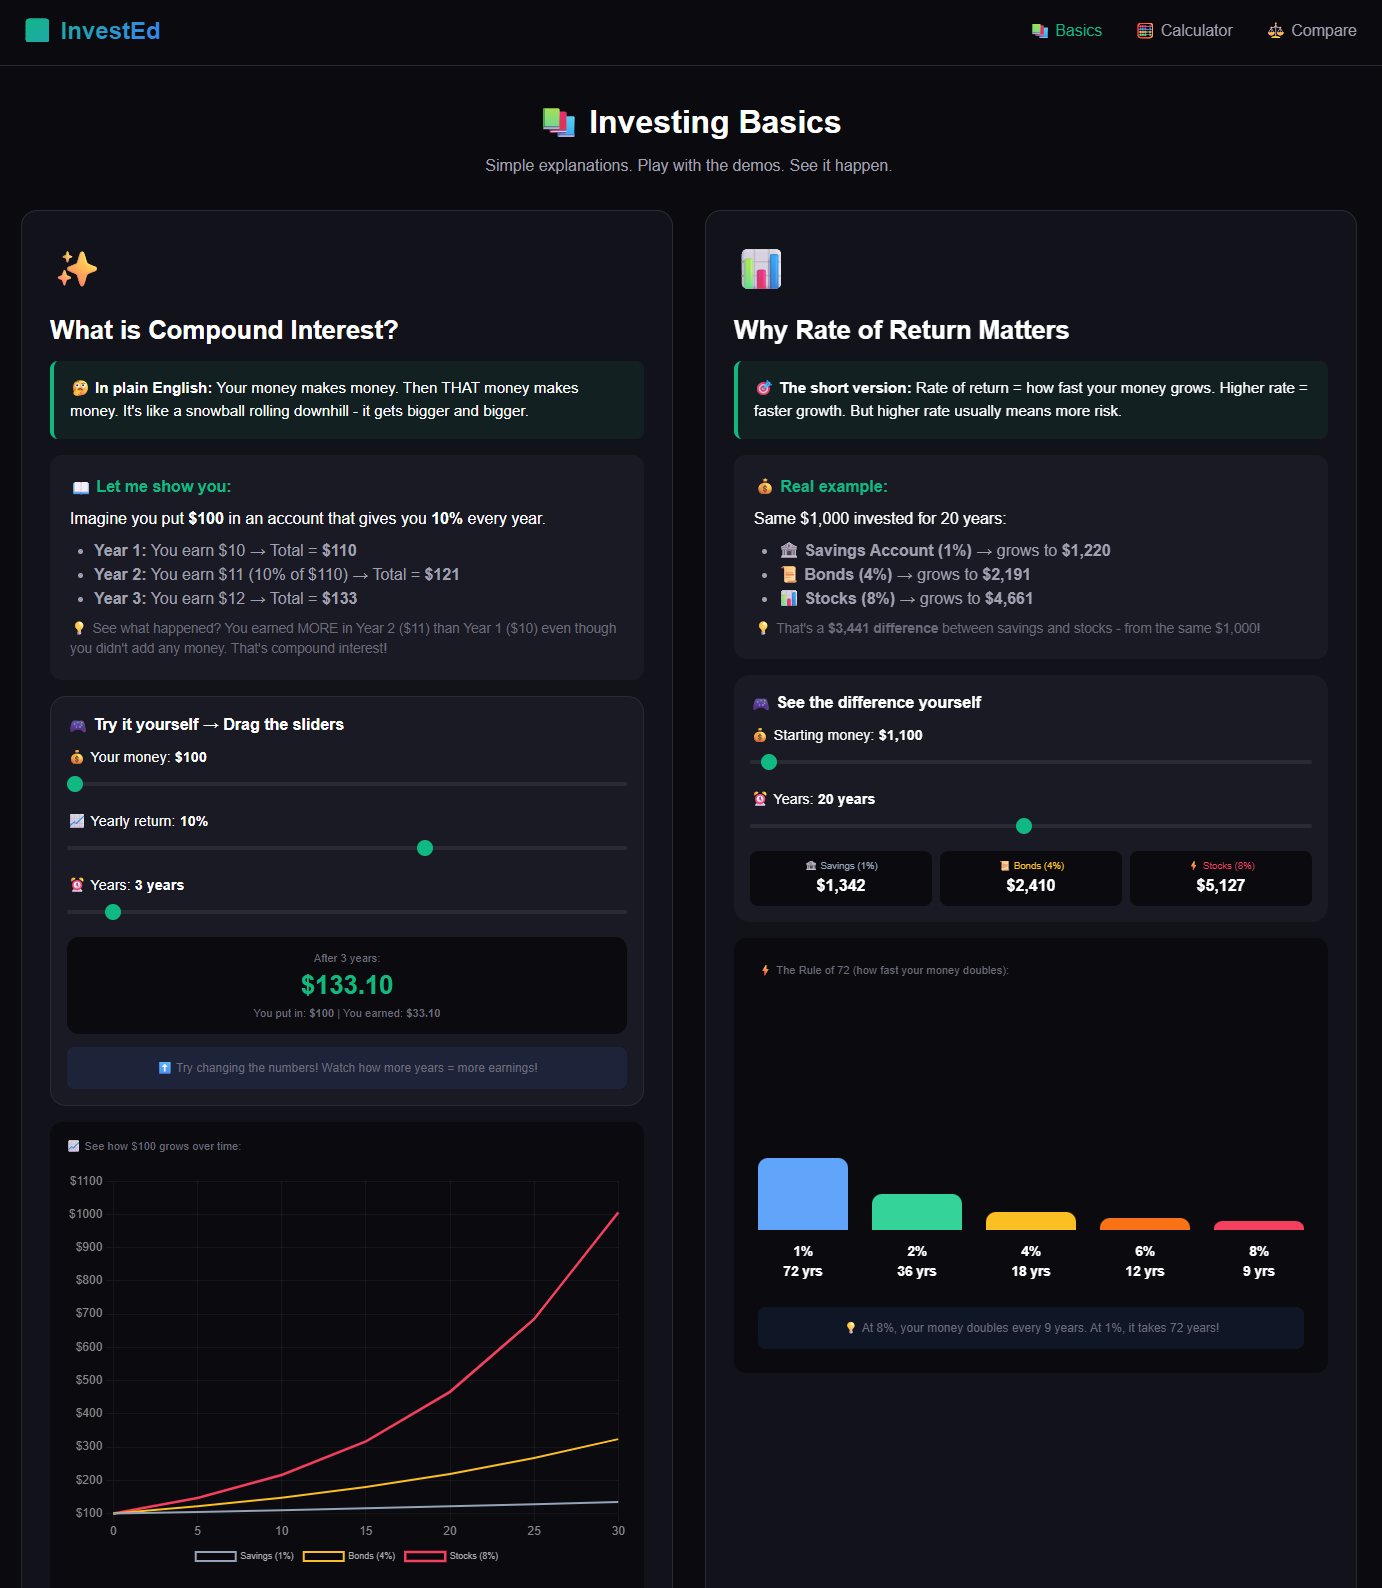
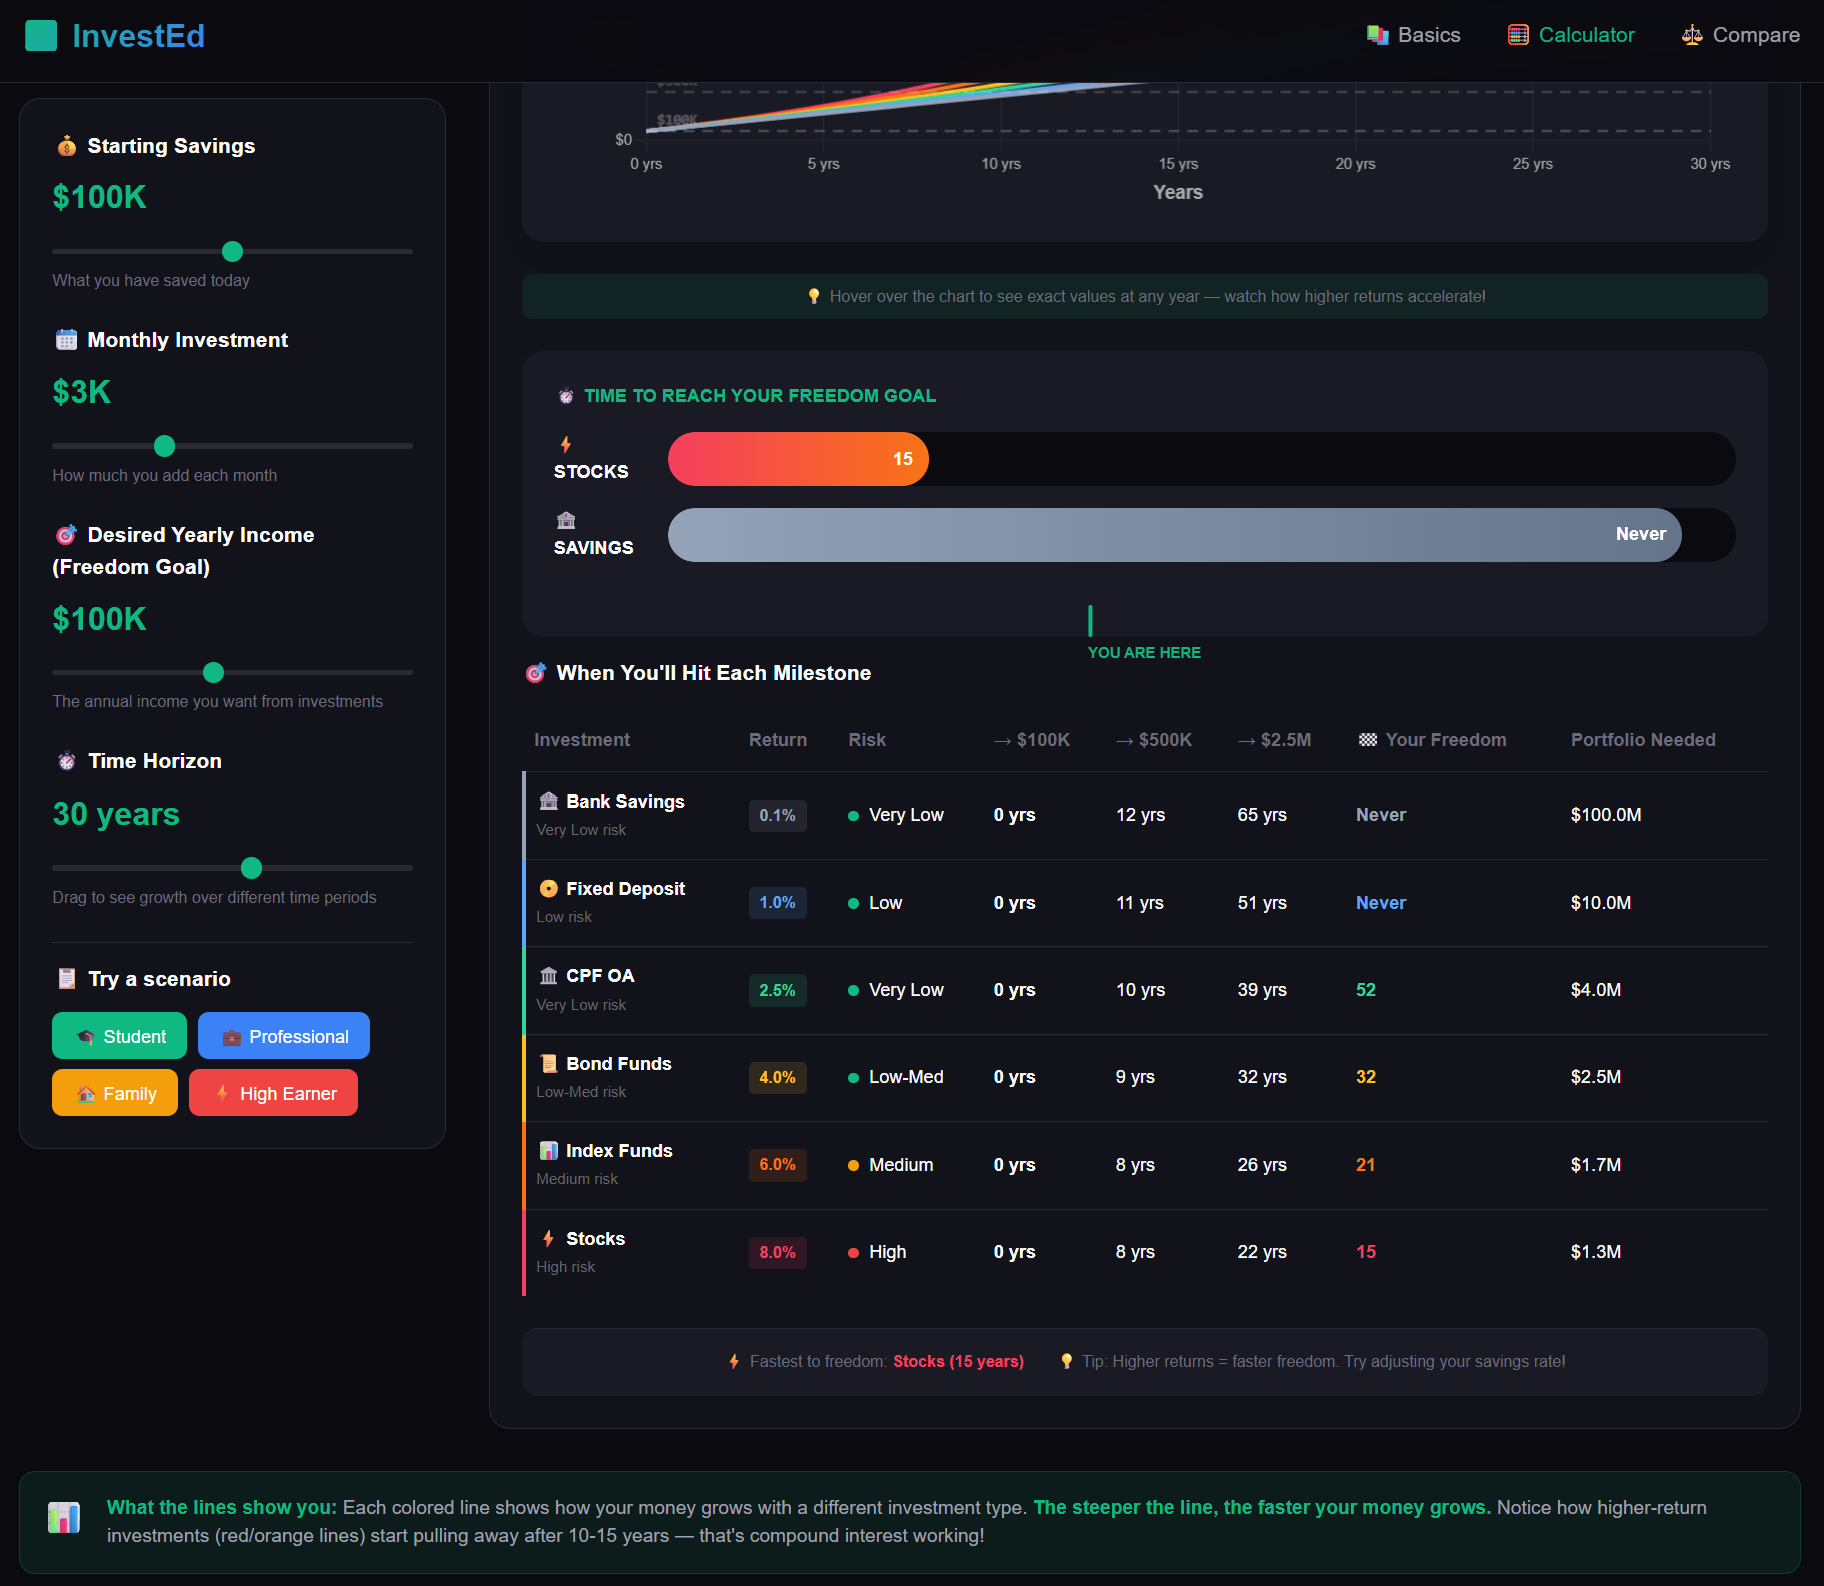
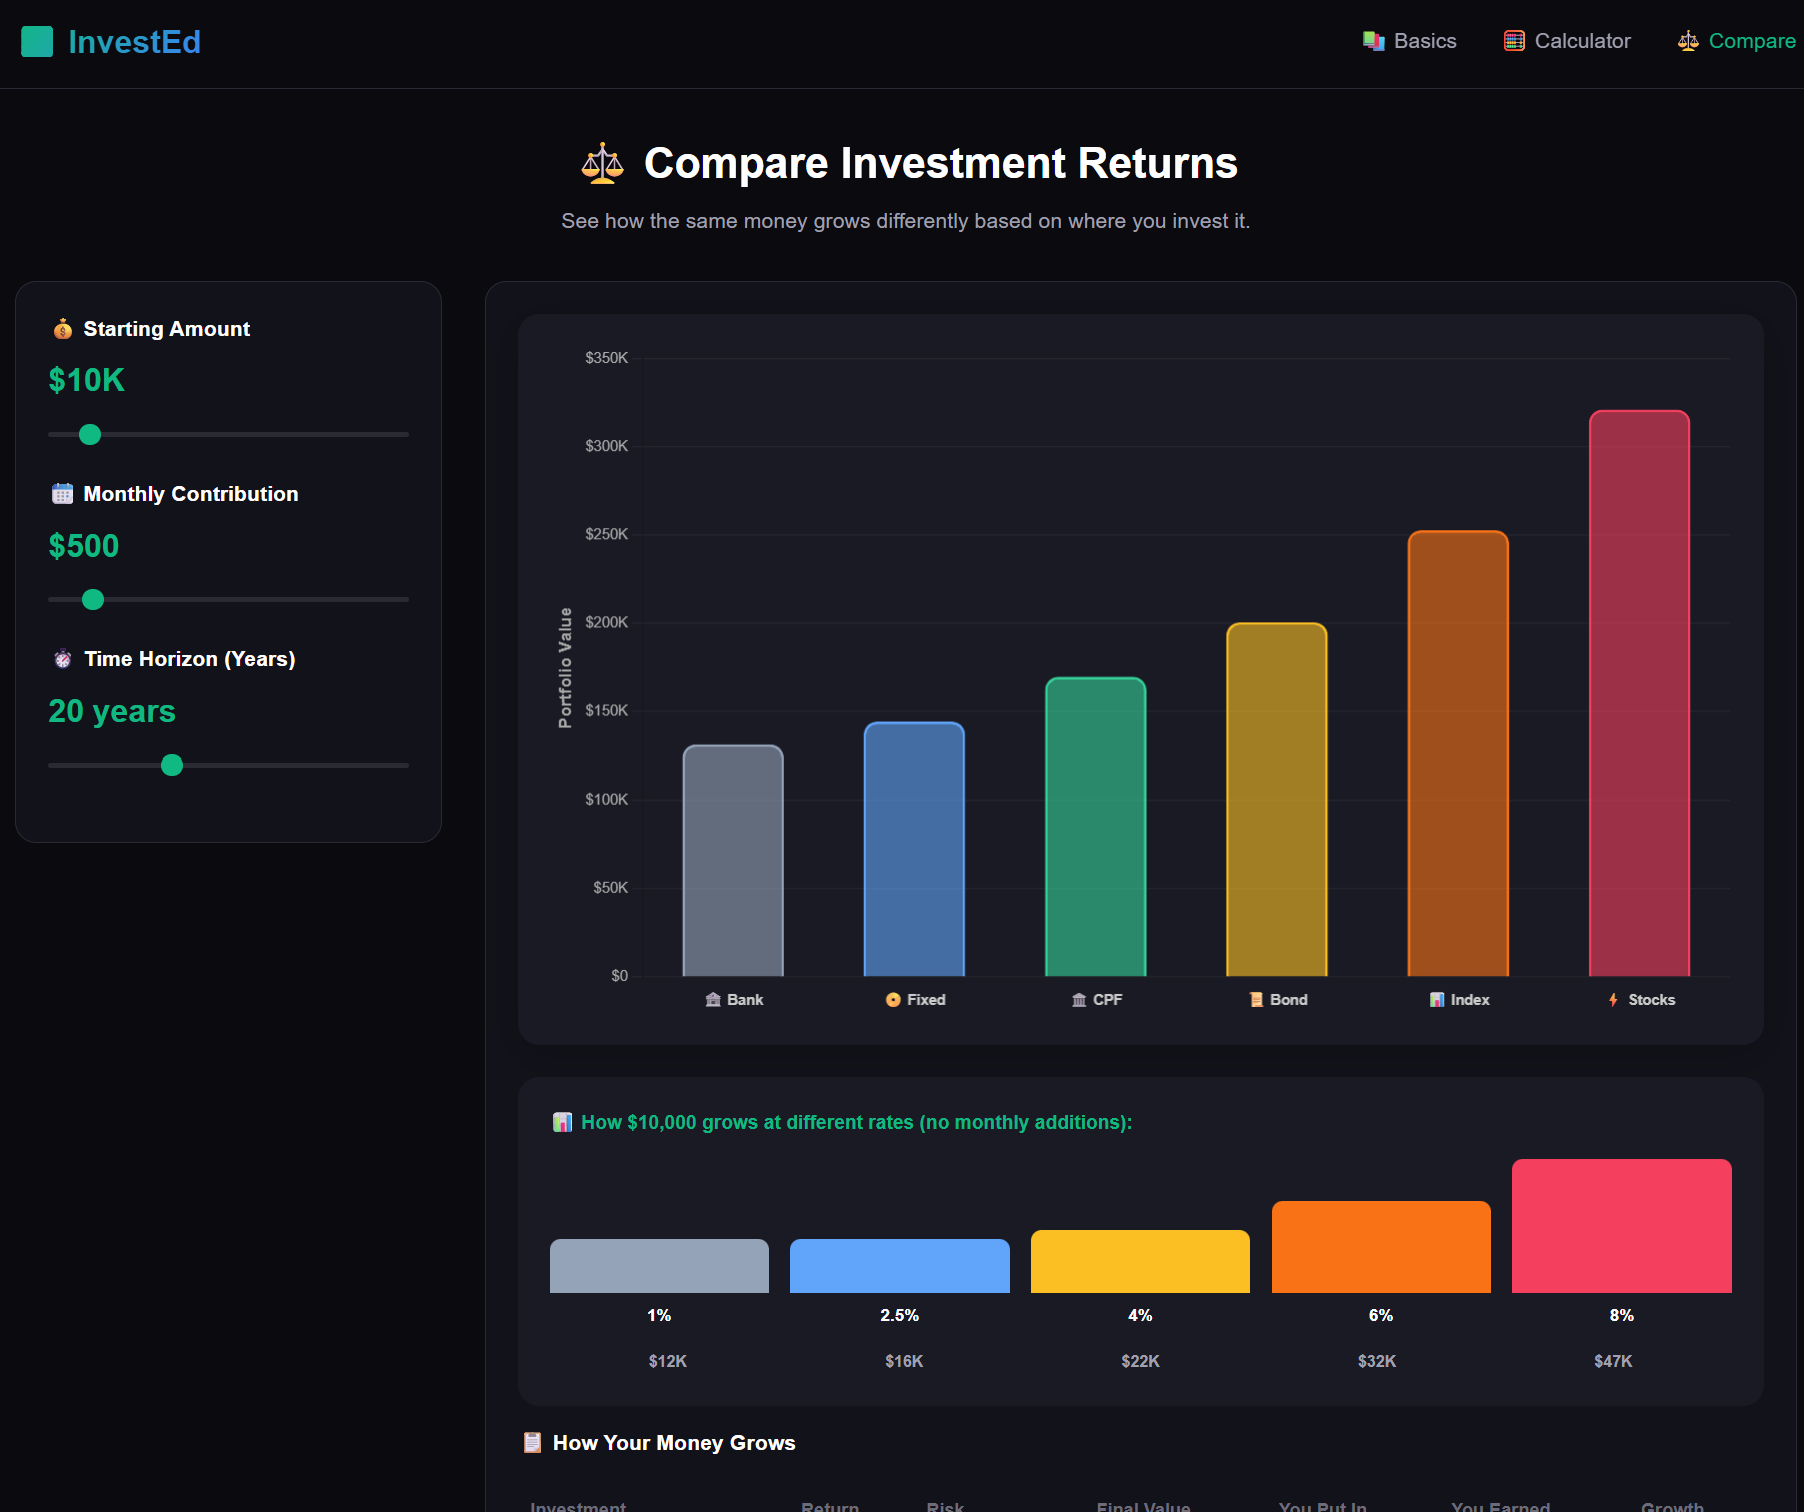
Data Visualization Design: Custom-configured dynamic charts to display multiple investment growth trajectories (Savings, Bonds, Stocks) simultaneously over a 30-year horizon.
-
UI/UX Development: Crafted a modern, dark-themed interface focused on information hierarchy, ensuring that complex data remains scannable and easy to digest.
-
Interactive Feature Implementation: Developed functional modules including milestone trackers, wealth calculators, and pre-set user scenarios for instant personalization.
The Problem
The Solution
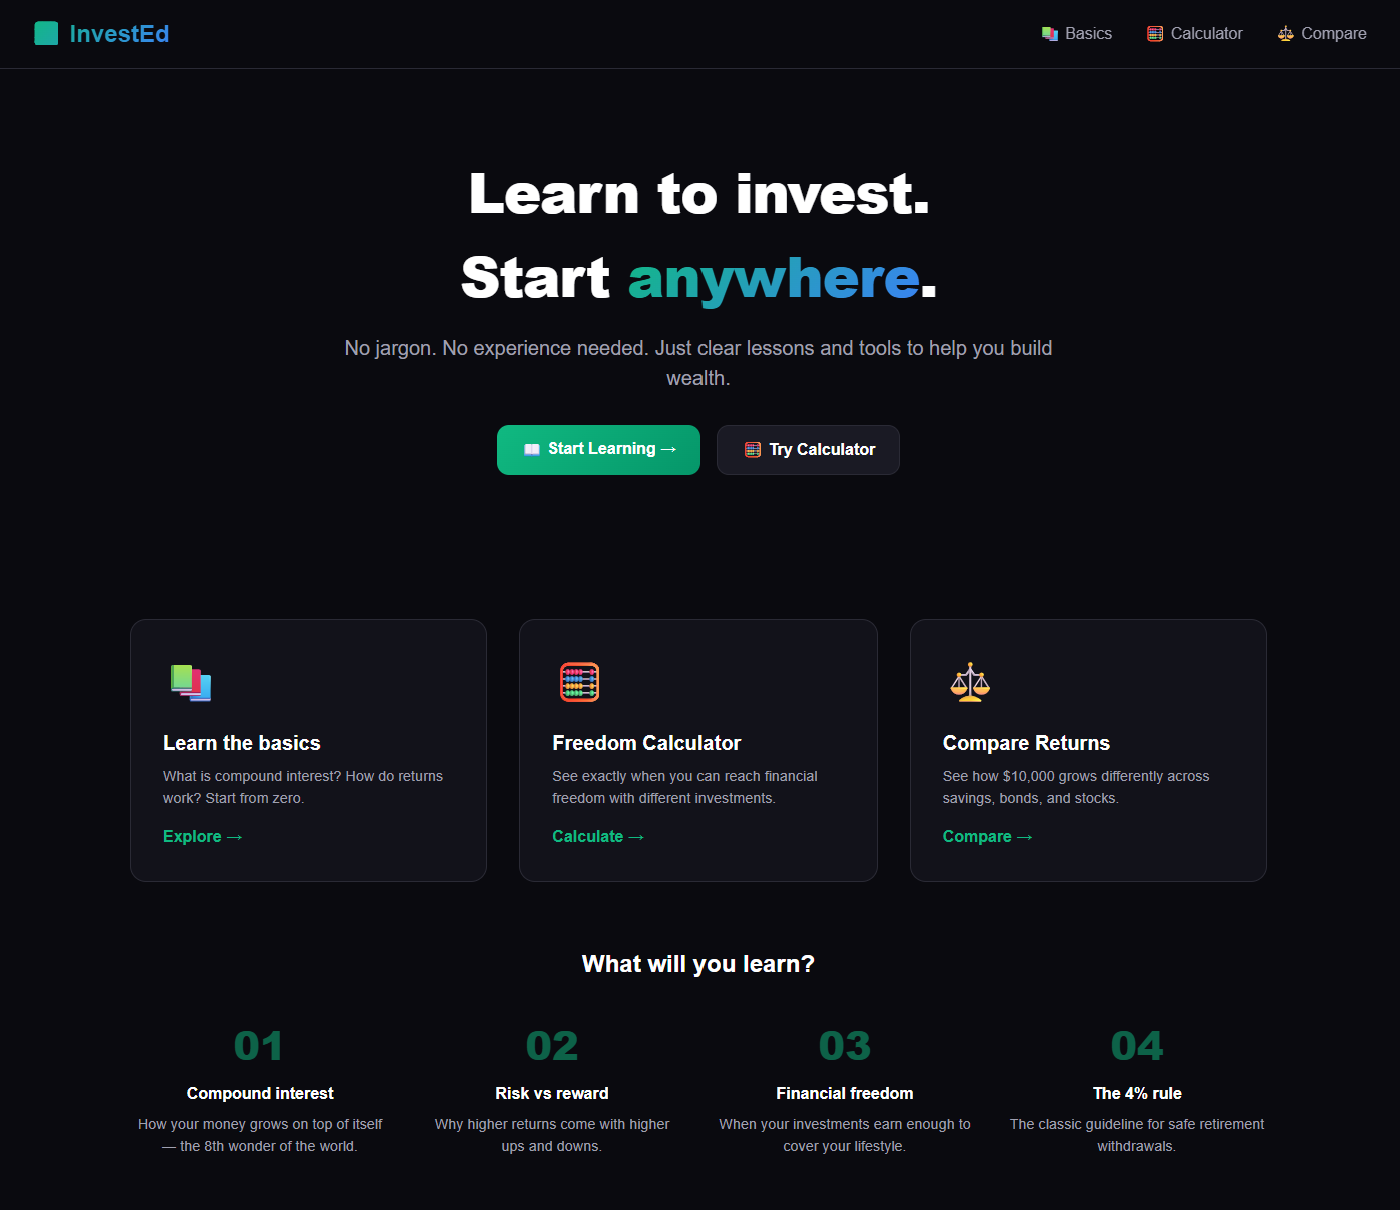
For many, the barrier to investing isn't a lack of interest, but a lack of visual clarity. Most financial tools are static, filled with jargon, and fail to show the "big picture" impact of small, consistent financial decisions.
InvestEd transforms abstract financial concepts into an interactive, visual story:
-
Live Growth Engine: Users can manipulate variables like monthly contributions and see the immediate impact on their long-term wealth.
-
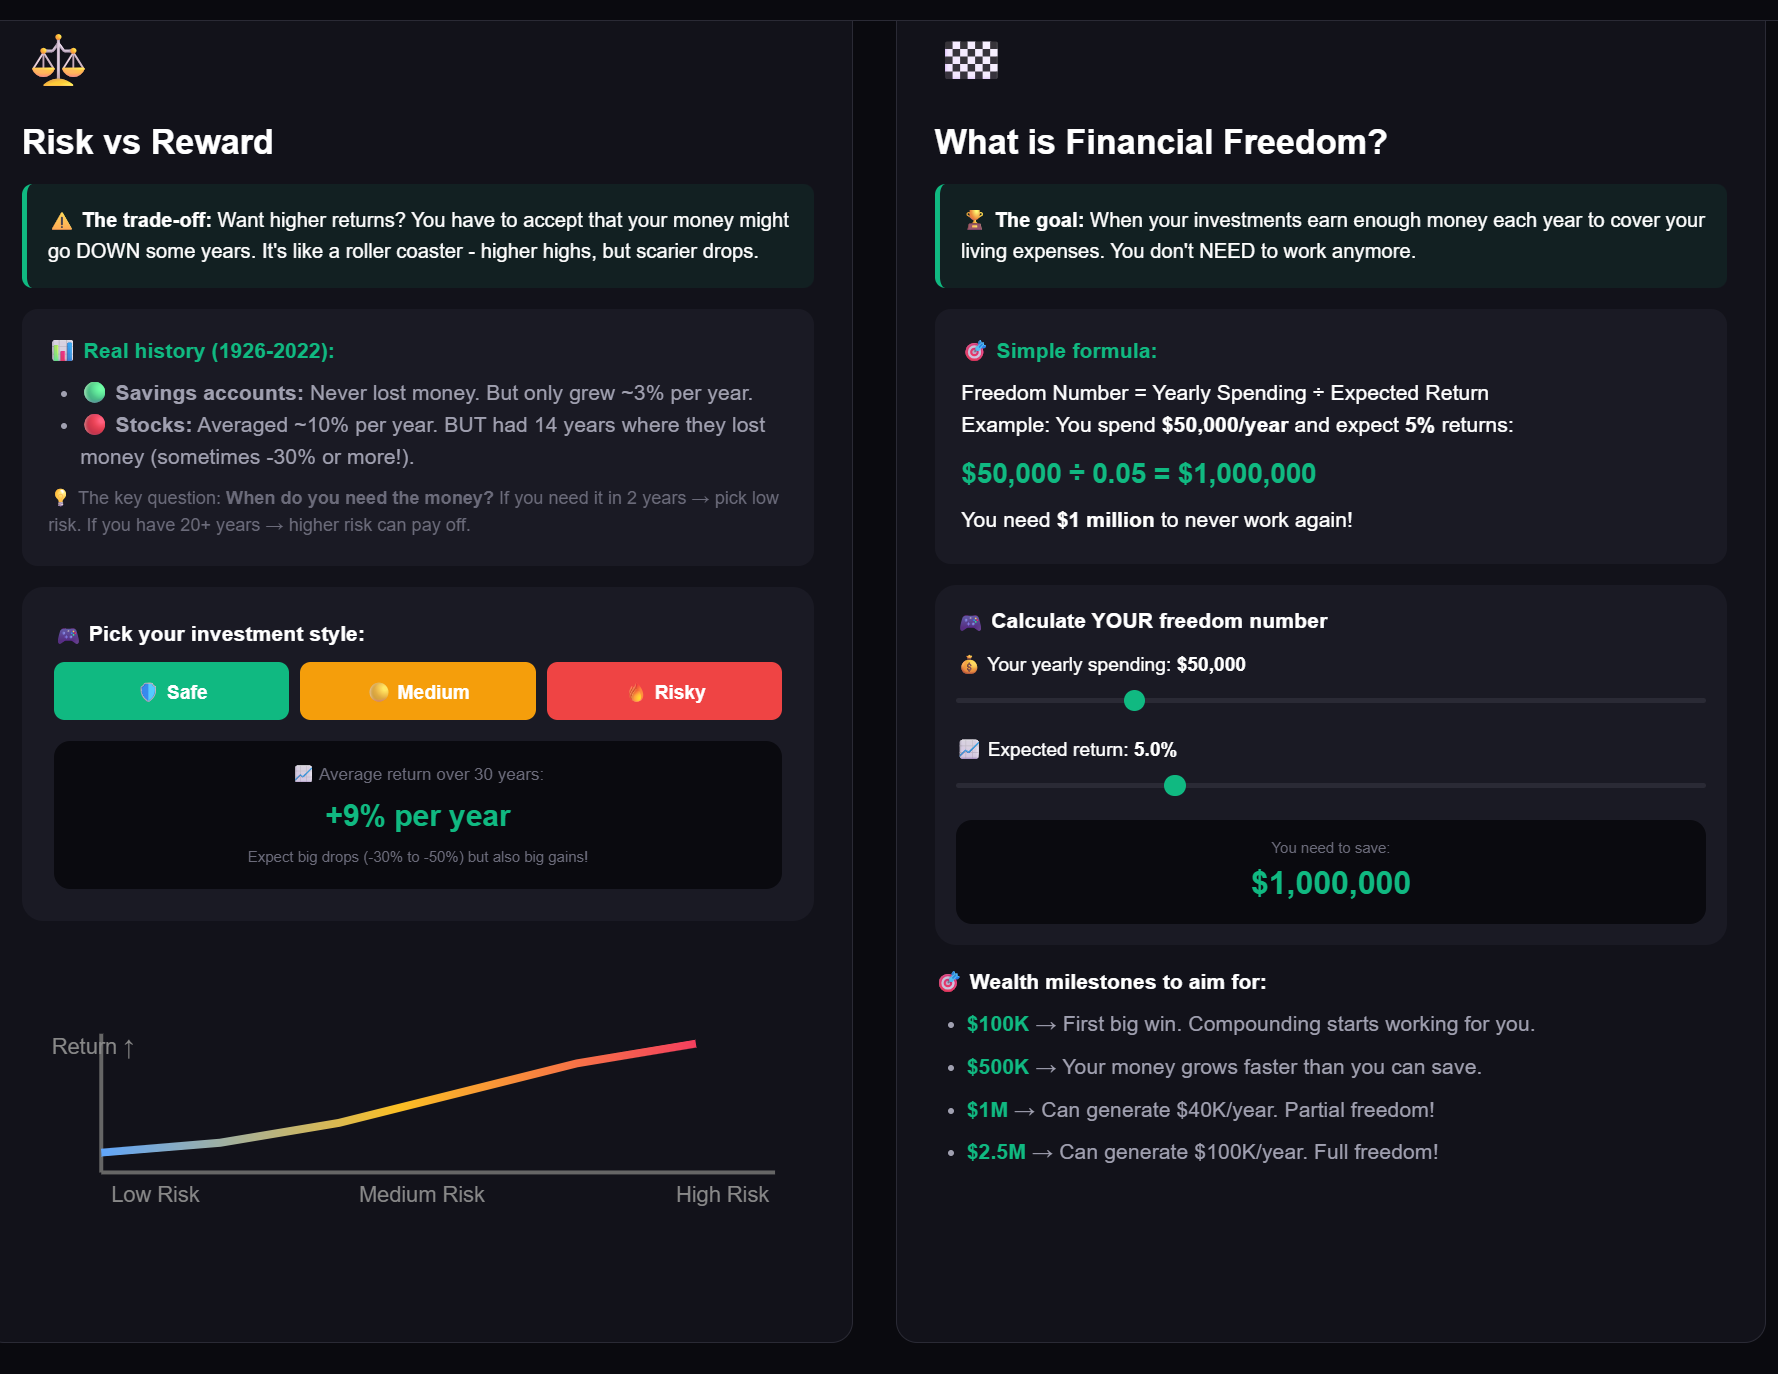
Educational Modules: Simplifies high-level concepts (like the 4% Rule) into bite-sized, interactive lessons.
-
Comparative Analysis: Provides a clear, side-by-side look at how different interest rates affect the "Total Earned" over time.
Process
Results
-
Problem Identification & Research: The project began with a data analysis exercise designed by my dad who is an investment expert. I manually calculated various "Financial Freedom" scenarios—such as how many years it takes to reach $100k or $1M based on different interest rates—using complex future value formulas.
-
Logic Mapping & Automation: I realized that while the data was powerful, the manual calculation process was a barrier for most people. I decided to digitize this experience by translating the Word-based data tables into a dynamic Python backend. I mapped out the core logic for 6 different investment profiles, from low-risk Bank Savings (0.1%) to high-growth Stocks (8%).
-
Full-Stack Development: Using Flask, I built a server to handle the calculation requests. I then developed an interactive frontend using JavaScript and Chart.js to turn static numbers into a "live" growth engine. This allowed users to see the immediate impact of their financial decisions through a visual timeline rather than a spreadsheet.
-
Interactive Feature Engineering: To make the tool more relatable, I implemented "User Scenarios" (like the Student or Young Professional profiles) and built a "Milestone Tracker" that breaks down big financial goals into manageable targets, inspired by the original analysis exercise.
-
End-to-End Delivery: Successfully launched a full-stack application that translates complex financial theory into a functional user tool.
-
Impactful Data Clarity: Built a comparison engine that effectively demonstrates the "wealth gap" created by different asset classes.
-
Scalable Foundation: Developed a clean, modular codebase that allows for easy addition of new investment types or financial modules.
Tech Stack
-
Backend: Python (Flask)
-
Handled the core application logic and server-side processing.
-
-
Frontend: HTML, CSS, and JavaScript
-
Designed a modern, dark-themed user interface with interactive elements like sliders and real-time updates.
-
-
Data Visualization: Chart.js
-
Used to transform numerical data into interactive line and bar charts to show long-term growth.
-
-
Core Logic: Custom Mathematical Algorithms
-
Developed the calculation engine to simulate various investment returns and wealth-building scenarios.
-


