Protein Intake Dashboard
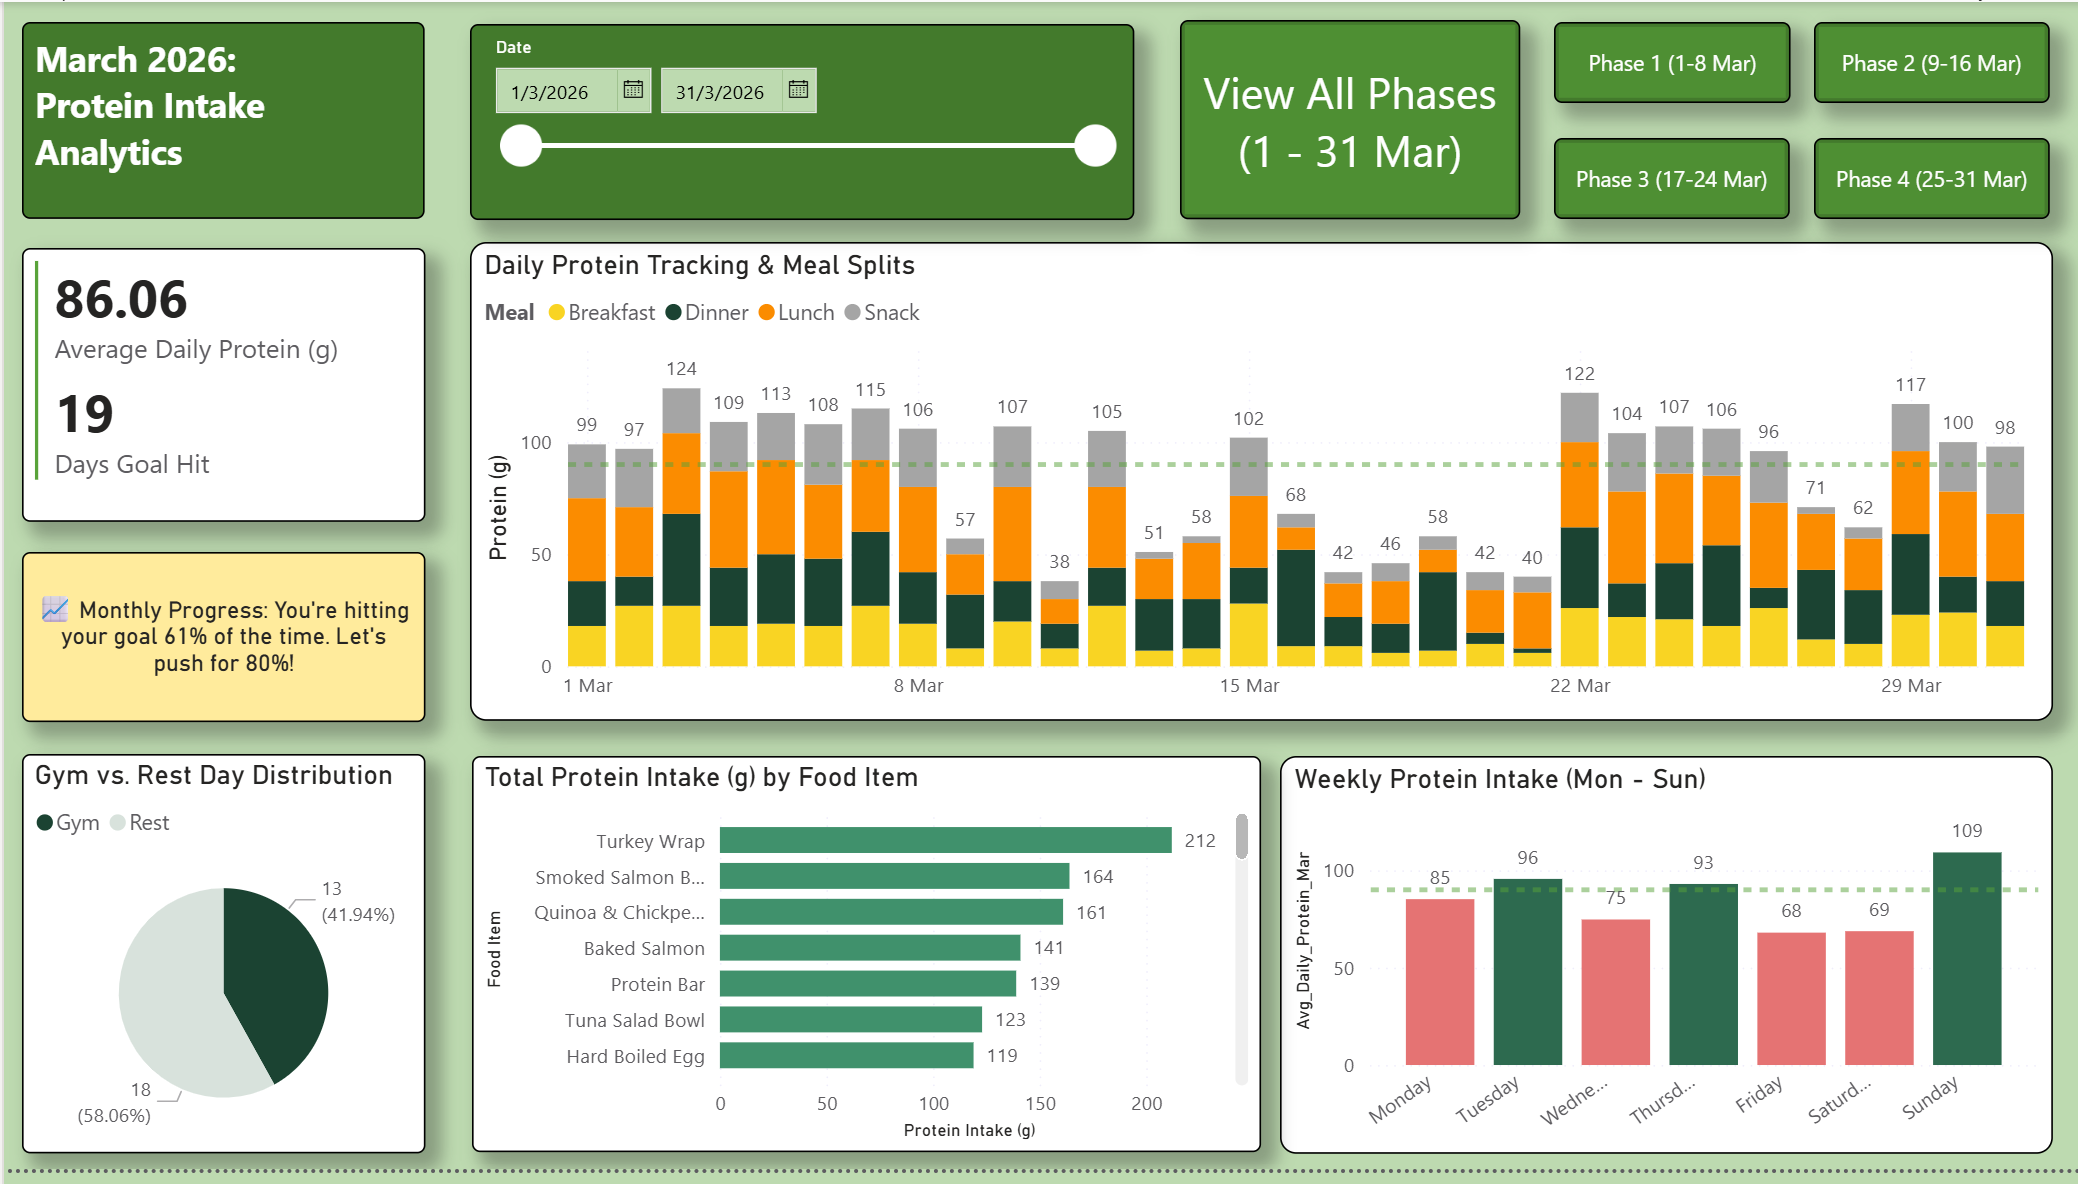
A dynamic, end-to-end Power BI solution designed to track and optimize daily protein intake. This project transforms a month’s worth of raw nutritional data into a responsive dashboard that provides automated coaching tips and performance visualization based on a 90g daily target.
The Brief
Target Audience
-
Fitness Enthusiasts: Individuals looking to move beyond simple logging to find long-term patterns in their nutrition.
My Role
I was responsible for the entire lifecycle: from data collection and schema design to developing the DAX measures and designing the interactive front-end.
The Problem
The Solution
Standard fitness apps often provide "snapshot" data but fail to show how nutrition fluctuates across different training phases or between gym and rest days. I found it difficult to identify why I was missing my 90g protein goal on certain weeks, making it hard to adjust my meal prep effectively.
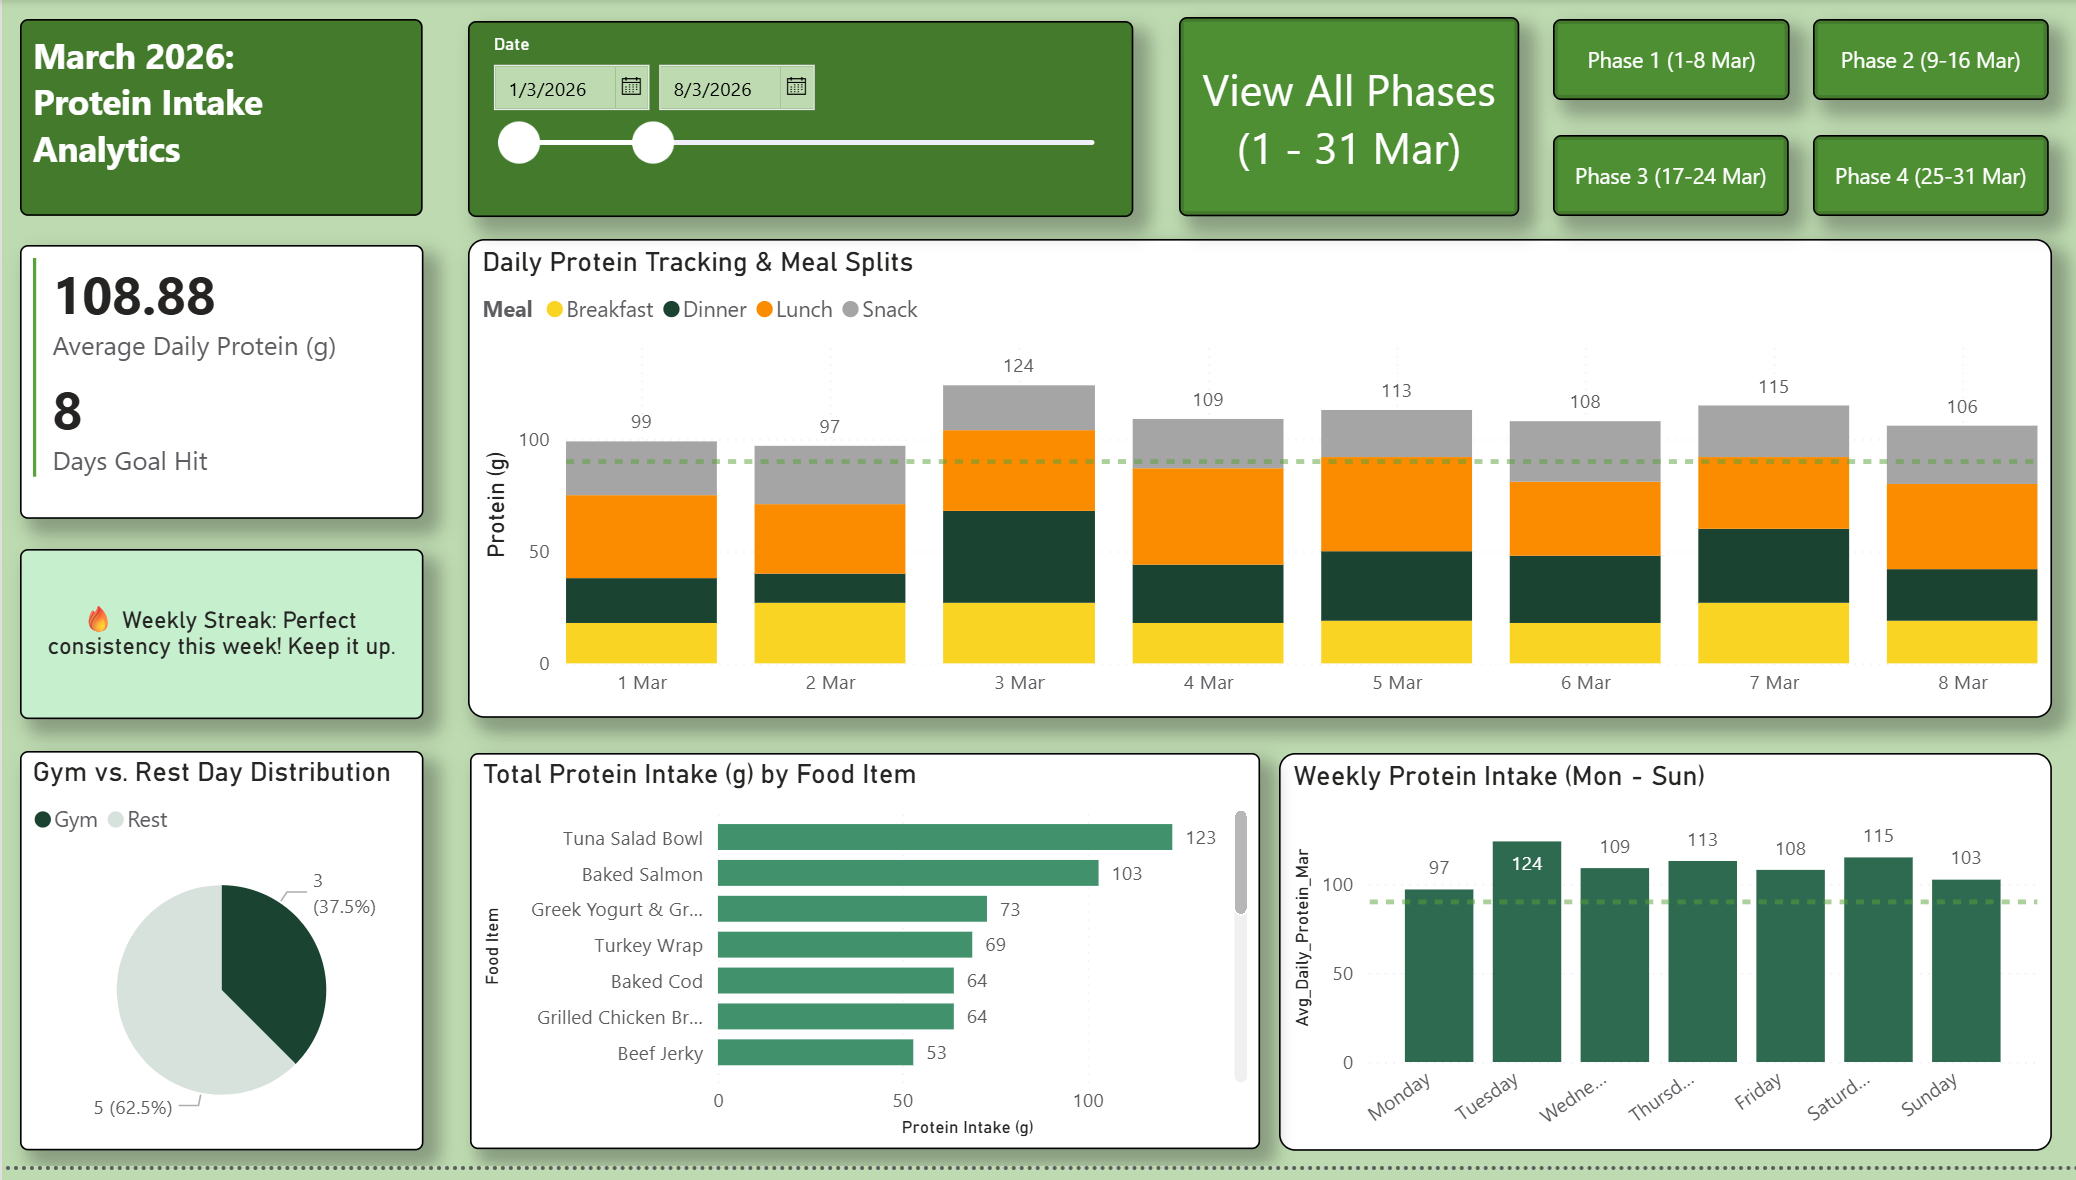
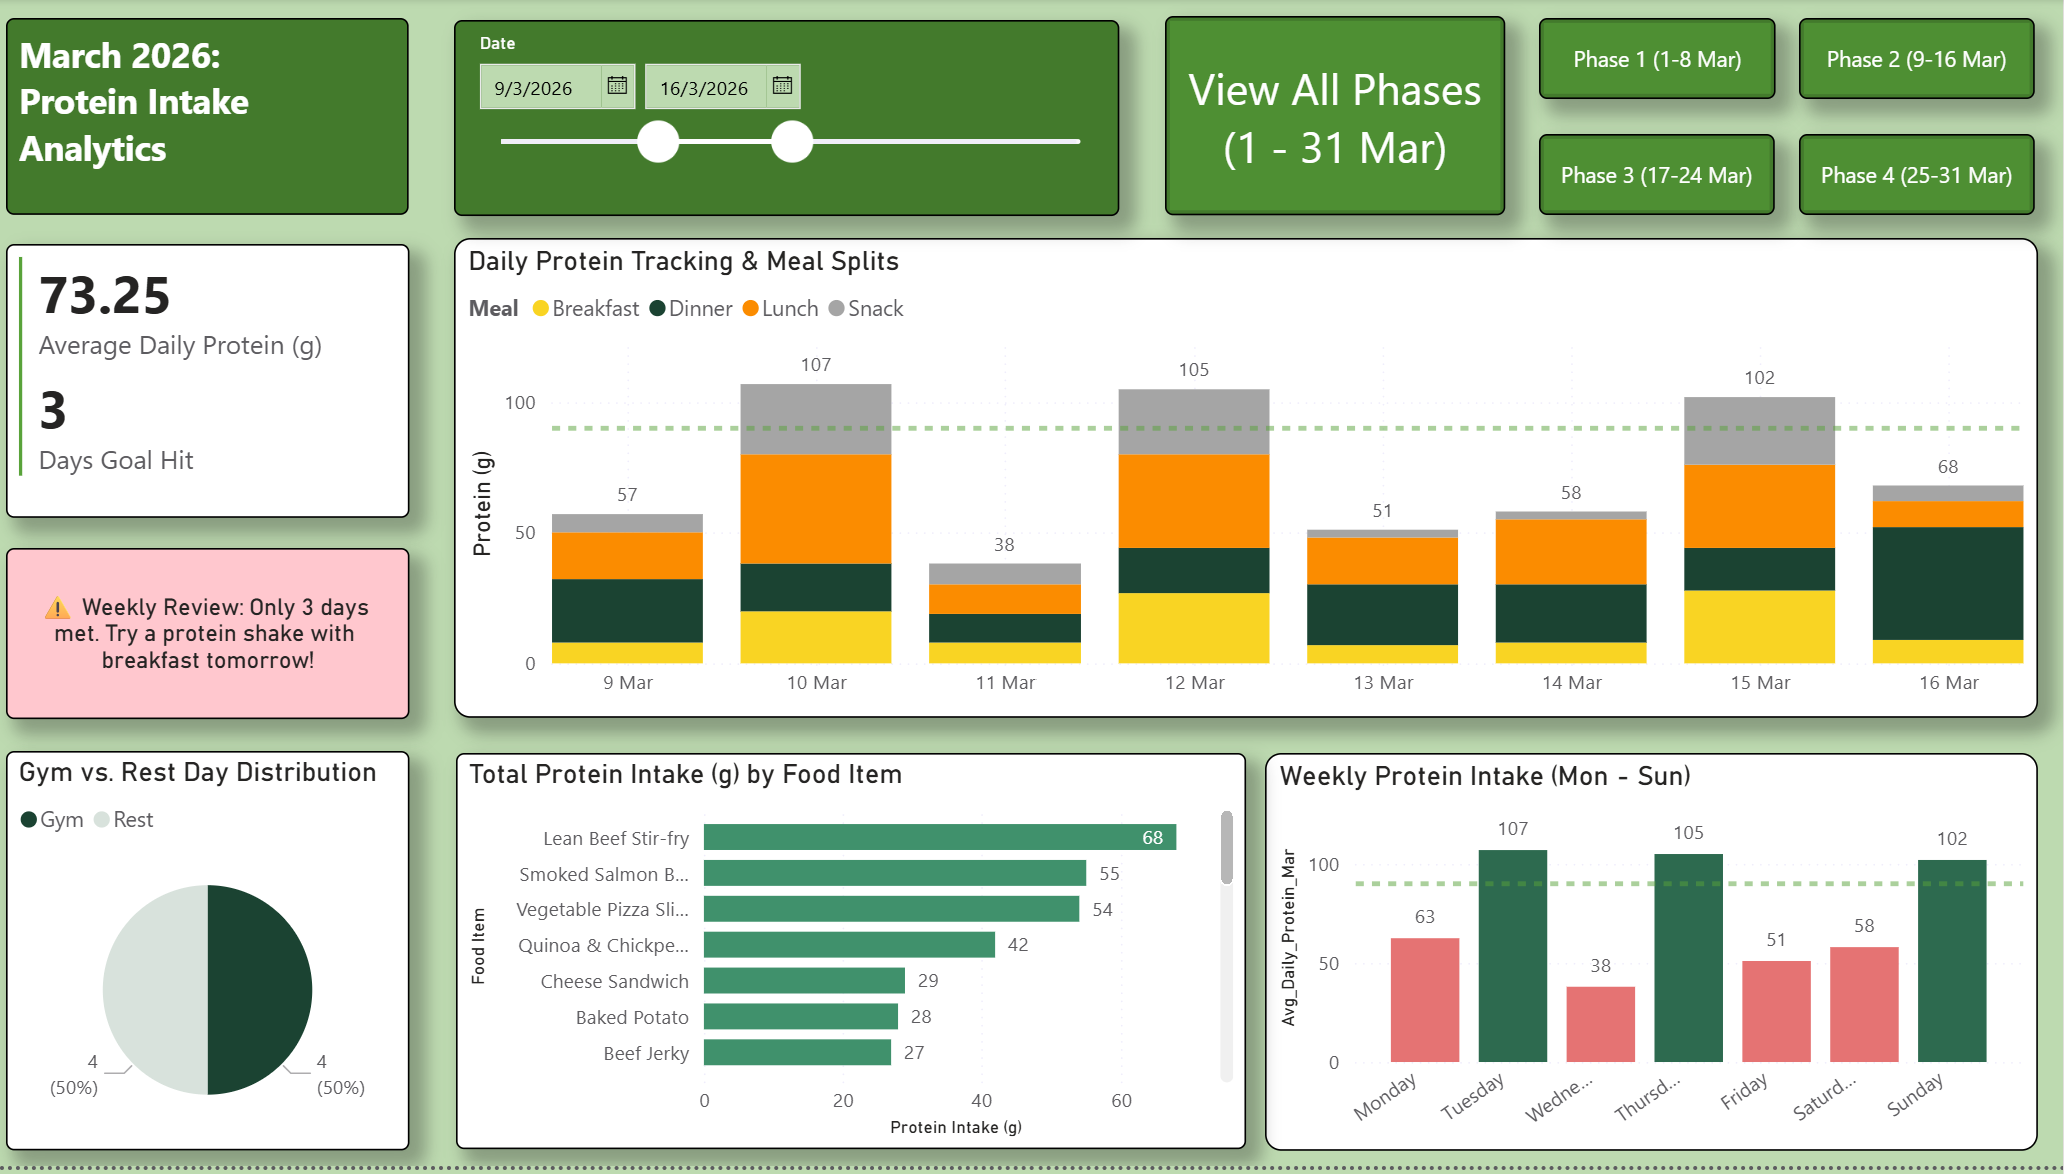
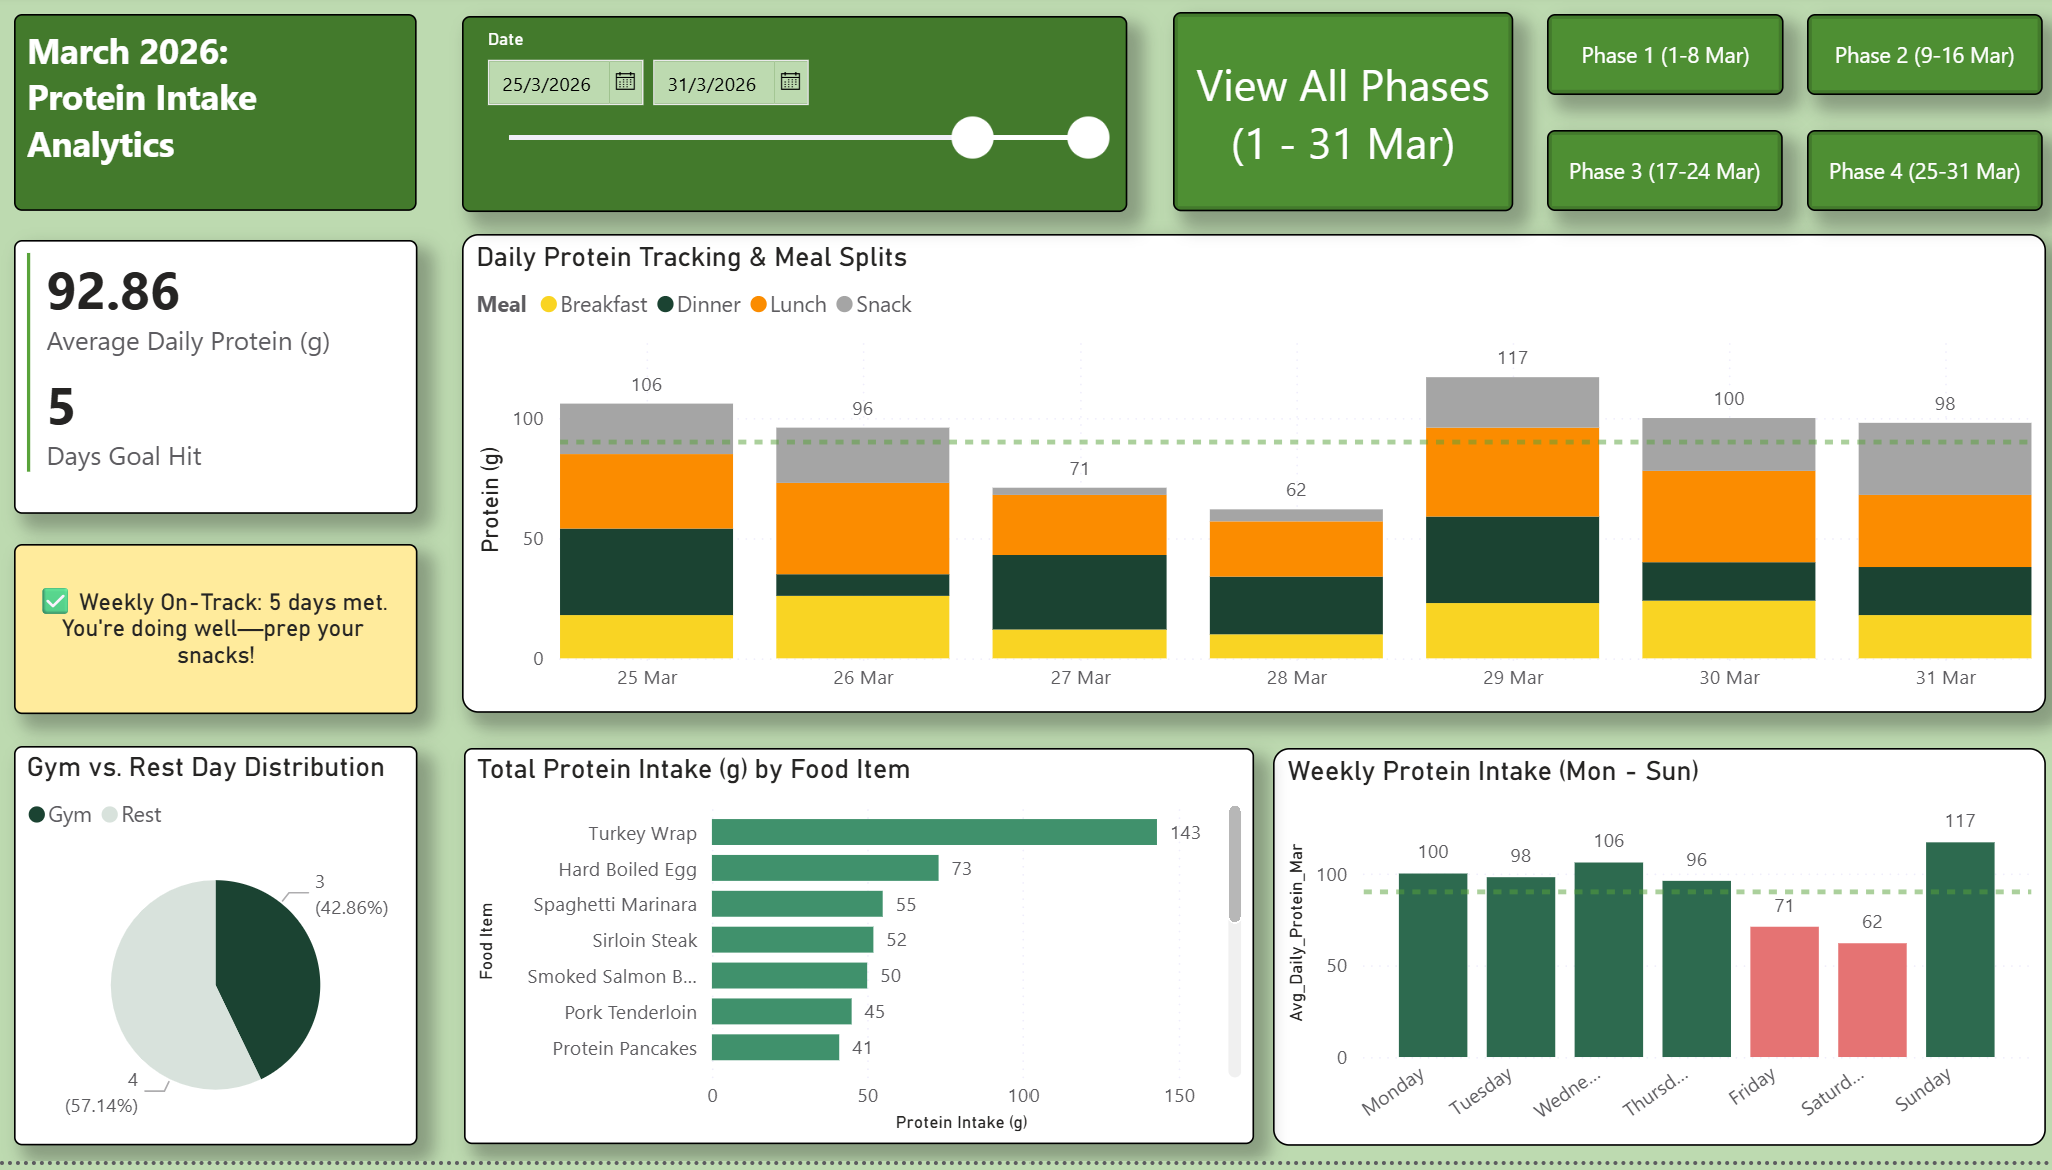
built a Phase-Based Tracking System in Power BI. Unlike a static report, this dashboard uses conditional logic to change its theme and "advice" based on performance.
-
Success (Green): Rewards consistency with a "Perfect Week" badge.
-
Warning (Red): Triggers an alert when goals are missed, providing a specific nutritional tip to get back on track.
Process
Results
-
Data Collection: Logged daily meals, protein counts, and activity levels (Gym vs. Rest) for March 2026.
-
Data Modeling: Used Power Query to structure the data, ensuring food items were categorized correctly for the "Top Protein Sources" bar chart.
-
DAX Development: Created measures for Average Protein, Goal Hit Count, and % Consistency.
-
UI/UX Design: Implemented a clean, "Green-Health" aesthetic with a custom navigation pane (Phase 1–4) to allow for granular weekly reviews.
-
Iteration: Added the "Monthly Progress" commentary box that updates dynamically based on the filtered date range.
-
Actionable Insight: Identified a 15% drop in protein intake on Rest Days, leading to a revamped "off-day" meal plan.
-
Goal Mastery: Achieved a 61% Goal Hit Rate for the month (19 days), with a clear roadmap to reach an 80% target in the following month.
-
Efficiency: Automated the analysis of meal splits (Breakfast/Lunch/Dinner/Snack), reducing the time spent reviewing nutrition from hours to seconds.
Tech Stack
Tools: Power BI (Data Modelling & Visualization), Excel / CSV (Data Source)

.png)
.png)
.png)