Visual Analytics Project
This project aimed to use data visualisation and statistical modelling to assess whether Singapore is on track to achieve a zero‑waste future, as outlined in the Singapore Green Plan 2030.
The Brief
Target Audience
-
Government policymakers – to evaluate the effectiveness of waste management policies.
-
Members of the public – to understand how their recycling habits contribute.
-
Environmental advocates – to gain data‑driven insights for sustainability campaigns.
The Problem
Plastic waste is widely seen as a major environmental threat, but there was no clear data‑driven comparison of Singapore’s plastic waste trends against other waste types or a global benchmark. The problem was to visualise whether plastic recycling efforts are effective and whether Singapore’s plastic waste management aligns with a sustainable future.
Process
-
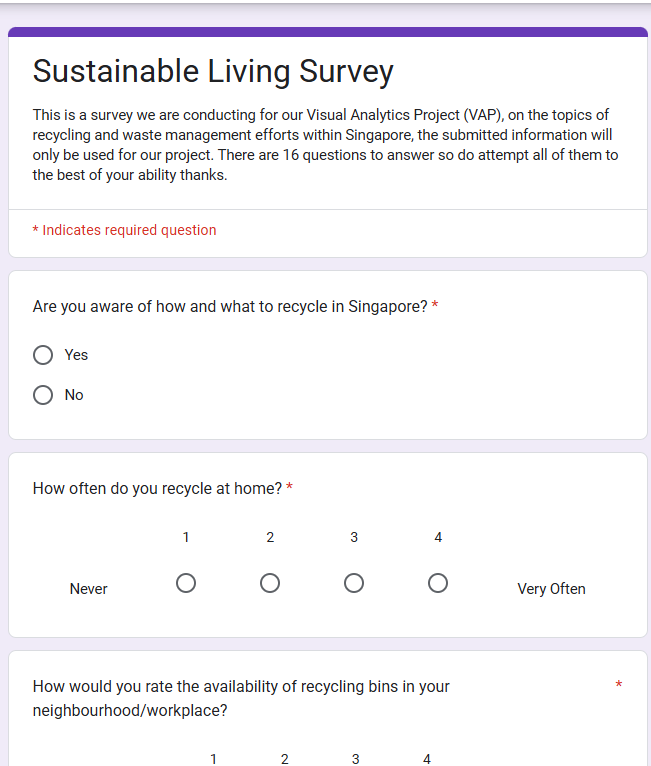
User requirements – Helped design interview questions to understand public perception of plastic waste.
-
Data preparation – Sourced local waste data from data.gov.sg and global plastic waste data from Kaggle; cleaned and transformed data in Power Query (transposing, unpivoting, splitting columns).
-
Visualisation – Created line charts, pie charts, map visualisations, and tables with interactive slicers, tooltips, and navigation.
-
Modelling – Applied linear regression to predict future recycling rates, waste generated, and waste disposed.
-
Iteration – Refined visuals based on team feedback and integrated findings into the final report.
Tech Stack
Tools: Power BI (Data Modelling & Visualization), Google Forms (Collect survey data)
Project Gallery


Interactive Demo
My Role
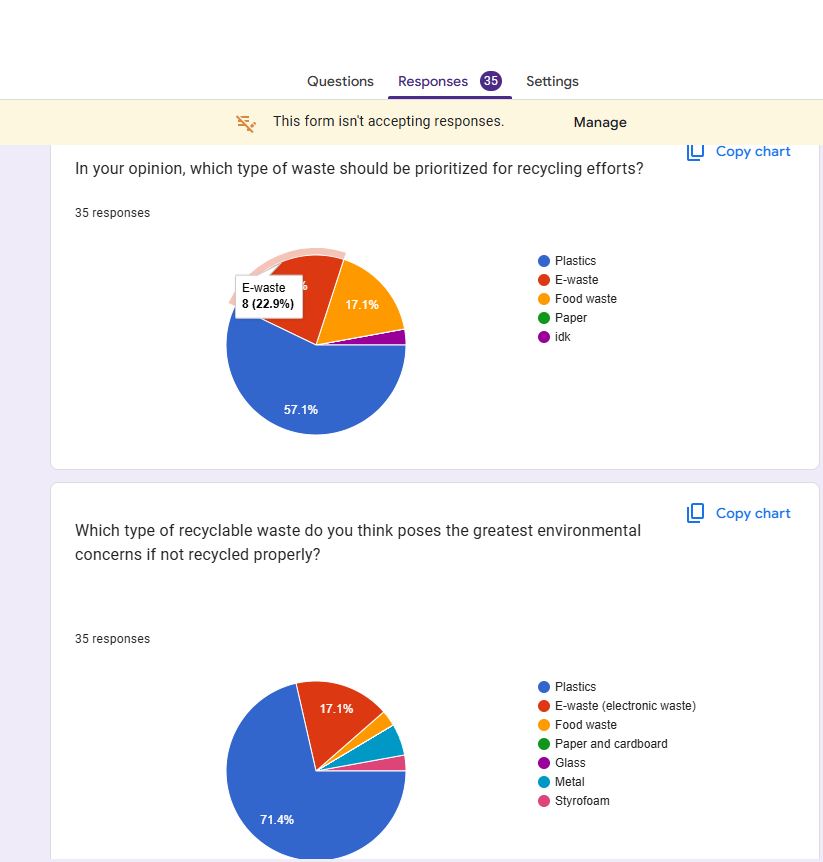
I was responsible for the plastic waste and environmental impact sub‑hypothesis:
“People see plastics as the most important waste type to recycle because of the harm they can cause if not managed properly.
The Solution
I built an interactive Power BI dashboard that:
-
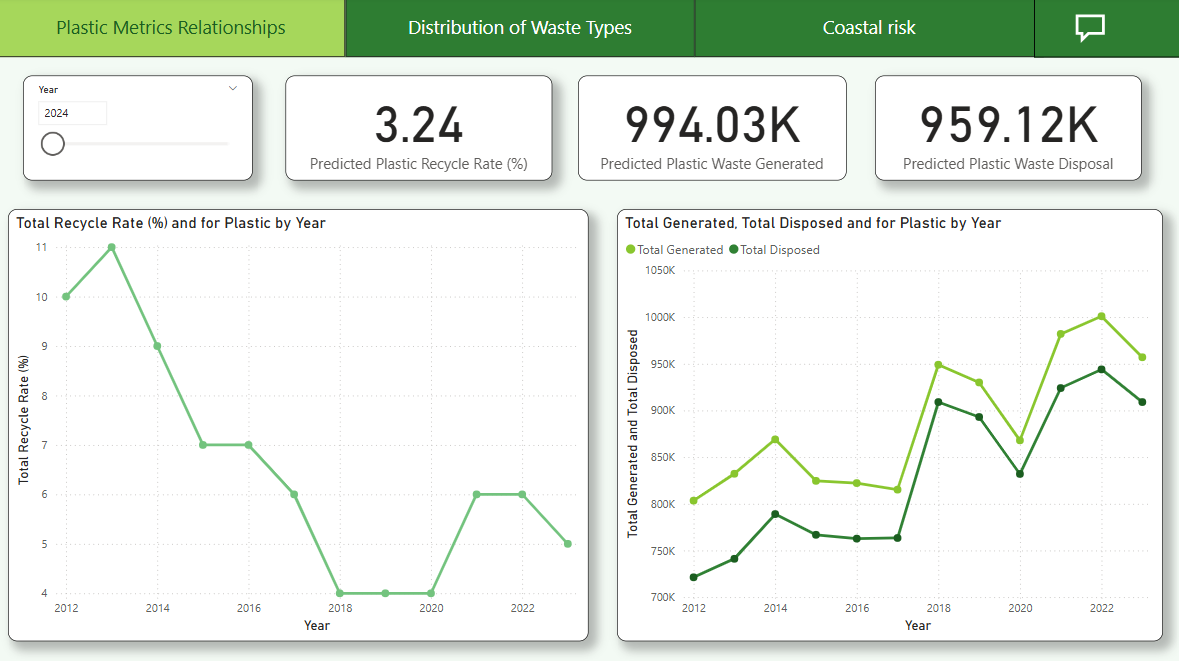
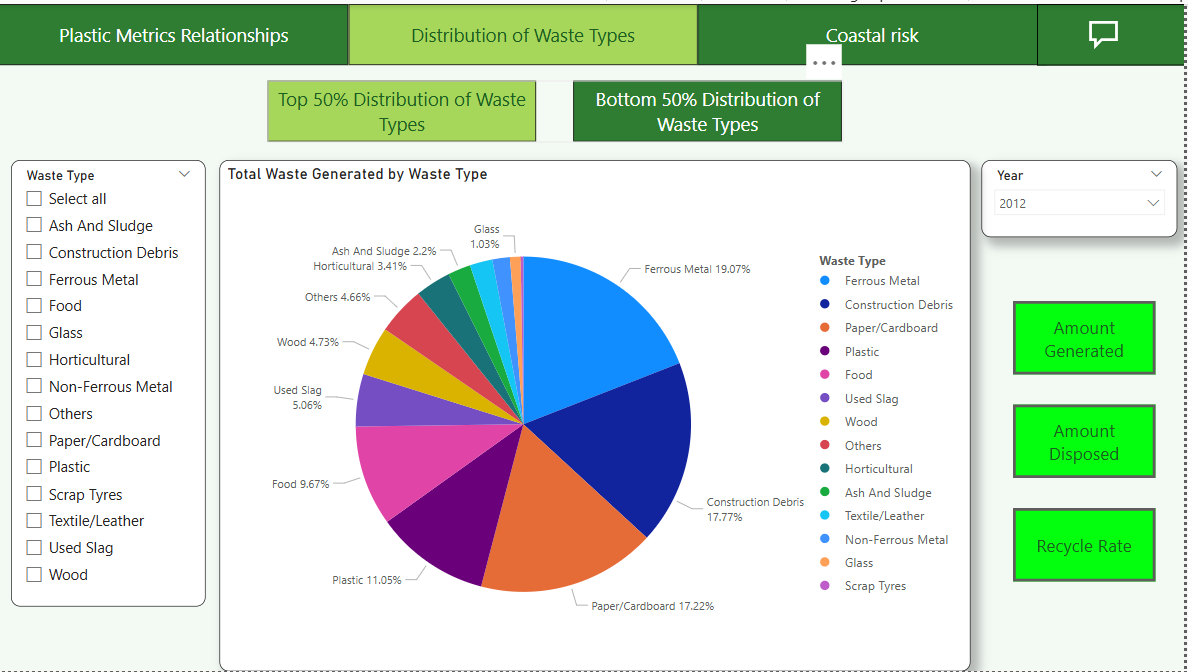
Compares plastic waste metrics (generated, disposed, recycled) with other waste types over time.
-
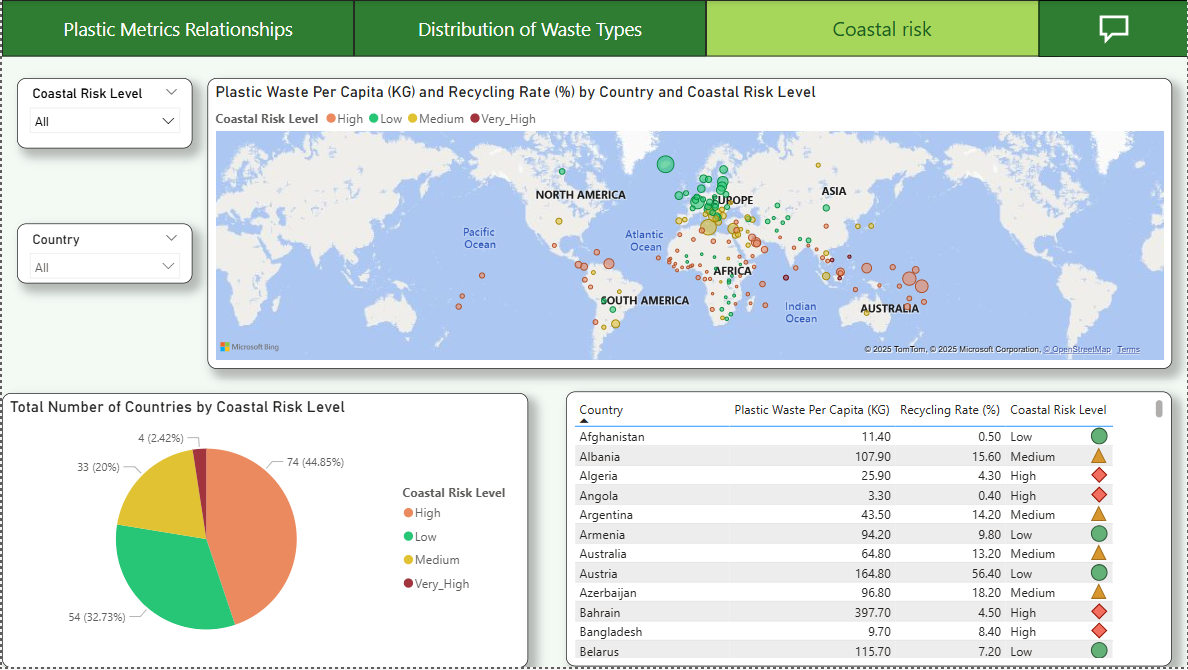
Displays global coastal waste risk levels to benchmark Singapore against other countries.
-
Uses linear regression to forecast future plastic waste trends beyond 2023.
Results
-
Trends identified: A decline in plastic recycling rates correlates with rising waste generation and disposal, signalling a growing environmental concern.
-
Recycling Metrics Comparison: Plastic disposal ranks among the highest of all waste types, but its recycling rate is consistently near the bottom.
-
Global comparison: Singapore performs relatively well in coastal waste risk compared to neighbouring Southeast Asian countries, but plastic waste management still needs improvement.
-
Recommendations: Improve recycling bin accessibility, launch targeted awareness campaigns, and encourage reusable alternatives.